Q1 Spin Out
Introduction
The Superb Slushie Company is having a problem! You've discovered something very interesting; no matter what color your slushie is, there is only one flavor. The store has an interesting advertising approach (which is why you go there): the customer spins a spinner when they give their order and that determines the color of their slushie. How many times would you have to order to get one of each color? Explore this by spinning, collecting and then analyzing the data.
A more advanced option is presented when the supplier delivered unequal amounts of the colors. What happened to the slushie orders?
Key Vocabulary:
Sum: the function of adding cells in a spreadsheet (=sum)
Probability: A number between zero and one that shows how likely a certain event is to occur
STEPS:
1. Start by checking with your teacher about which document you will be using for this activity:
- Google spreadsheet template you will go to the Google File menu and "Make a copy" and name it "Spinner + your initials",
- or download and use this Excel spinner template spreadsheet
2. Work with a partner (or small group).
- Spreadsheet Operator: Open the spreadsheet and save it with your name and spinner in the title ready to use.
- Spinner: Open a blank document (word processing or presentation program) to input screenshots and answers to the questions posed as you go through this Spinner Project.
- Analyst: Your partner(s) will read the directions for each step and help analyze the data.
3. The "spinner" member of the group will go to this interactive spinner to simulate the colors at the Superb Slushie Company. The "spreadsheet operator" will record the data into the spreadsheet.
Part 1 Collect data
1.1. "Spinner" Look under the online spinner, click on the "Results" button to see the chart on the right, then enter the number 20 in the Spins box.
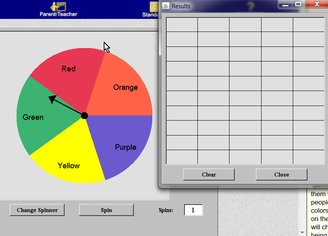
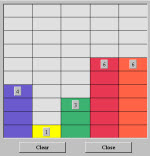
1.2. Click on "spin" button to see the results graphed..

Notice the numbers in each bar indicate how many times the spinner landed on that color out of the 20 times it spun.
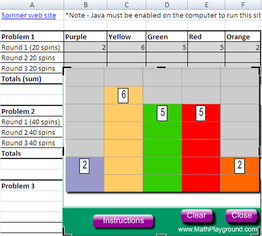
1.3. The "spreadsheet operator" should record the results in the Problem 1 section of the spreadsheet, as called off by the "spinner" partner, example shown below. "Spinner": when the "operator" is done, click the CLEAR button on the grid..
1.4. "Spinner": Spin the spinner another time and the "Operator" will record the results.
The Spinner should click on "CLEAR" to clear the results, and do these steps one last time so that you have 3 sets of results entered in your spreadsheet.
Part 2 Formulas
Your next step is to use a formula to have the spreadsheet add up the totals for you. You can do this by using the SUM function below.
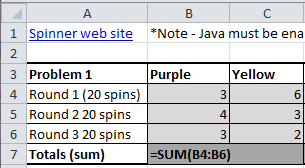
2.1. In the spreadsheet, put your cursor in the Total row under the Purple column (cell B7 in the example shown).
2.2. Type this formula into the cell to have it add up the numbers in cells in that column that are in B4 + B5 + B6.
To do this you would first enter "=SUM" (without the quotation marks, -- this tells the spreadsheet that you want to see the results of the formula that will follow). Following "=SUM" you should enter "(B4:B6)", again, minus the quotation marks. This is the formula that tells the spreadsheet to add the numbers in the cells from B4 through B6.
2.3 It should look like this: =SUM(B4:B6). After entering this formula, hit enter on your keyboard. This should put the total for how many times the spinner landed on Purple in the total cell for Purple.
The Spinner should click on "CLEAR" to clear the results, and do these steps one last time so that you have 3 sets of results entered in your spreadsheet.
Part 2 Formulas
Your next step is to use a formula to have the spreadsheet add up the totals for you. You can do this by using the SUM function below.
2.1. In the spreadsheet, put your cursor in the Total row under the Purple column (cell B7 in the example shown).
2.2. Type this formula into the cell to have it add up the numbers in cells in that column that are in B4 + B5 + B6.
To do this you would first enter "=SUM" (without the quotation marks, -- this tells the spreadsheet that you want to see the results of the formula that will follow). Following "=SUM" you should enter "(B4:B6)", again, minus the quotation marks. This is the formula that tells the spreadsheet to add the numbers in the cells from B4 through B6.
2.3 It should look like this: =SUM(B4:B6). After entering this formula, hit enter on your keyboard. This should put the total for how many times the spinner landed on Purple in the total cell for Purple.
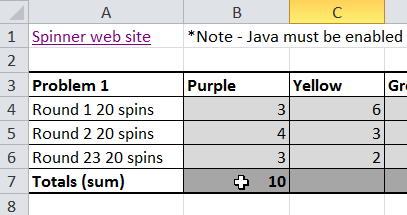

2.4. Find the totals for the other colors using the same formula. Remember that the numbers for the other colors are in different columns, so the letters in the formulas will change; Yellow is in column C, for example.
Part 3 Analysis, Prediction, and Global Results
Since all the color parts of the spinner are equal sizes, do you think that if you spin the spinner more times, that the results should be closer to an equal number of hits for each color?
3.1. Discuss this with your partner and make your prediction.
3.2. Now change the number of spins to 40 and repeat this same process as before, filling in the information into the Problem 2 section.
- Take some screenshots as you work and paste them into a word processing or presentation program to use later on.
- Be sure to make some notes about what you were doing with each screenshot to reference later on in your final Spinner Project report.
3.3. Global collaboration:
- Now one person from each team should click this survey link and enter your results into the global survey.
3.4 View the survey results entered from all the others across the globe. Take a screenshot of the global results and save it in your Spinner report document. Jot down the following observations for your report:
- The number of total results collected in the global survey.
- In your own results, how close were your results to the total survey results?
- As more students enter their results into the global survey, what do you expect to happen to the totals for each color?
3.5. Have a class discussion about how this compares to the global survey spinner results.
How many times did 1, 3, and 5 (prime numbers) occur in the global survey results? Why would this number be different from spinning the spinner 200 times?
3.6. Document your predictions to the following scenario based on your data in your Spinner Report document:
- If you walked into the Slushie store with five friends and you each spun the wheel for a slushie, what color or colors would you expect each of you to receive?
- Use the data you collected to predict and then compare with two other groups
- Defend how your data supports your answer
- Do all of you agree on the answers? Why or why not?
Part 4 Advanced Delivery Problem
The owner was very upset when the next delivery of their slushie mixes arrived. The truck didn't deliver equal amounts of the different color varieties! The delivery company gave them the following number of bottles of each color flavoring: 1 purple, 2 yellow, 3 green, 4 red, and 5 orange.
How could they make sure they would use up the colors they had in stock without running out?
A student worker in the store came up with a unique solution, "Offer a discount for the slushy colors they had too much of. The colored slices on the spinner were changed to represent the stock. To see how this idea worked out, you will need to change the spinner properties.
4.1. Spinner: Click the button on the spinner to "Change spinner."
4.2. Spinner: Change the numbers next to the different colors so that the chance of getting a discount on the flavors that are overstocked will be larger. Use the small arrow next to each color choice to change the numbers to the following:
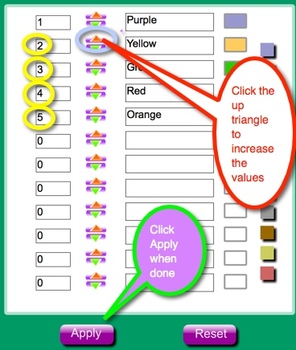
4.3. Click on the Apply button so that the spinner color slices are changed. Take a screenshot of your new spinner for your report.
4.4. Now before you repeat your research, your challenge is to make a prediction.
- Looking at your new spinner, which color will have the highest probability of hits, and which one the lowest out of 20 spins?
- Write your prediction into your document.
- Now keep track and spin the spinner 20 spins.
- Enter your results into your spreadsheet.
- How did you do?
4.5. If you spin it more times, will it be closer to your prediction?
- Do this two more times, remembering to record your data and to CLEAR the results when done.
- Total your three sets of results like you did earlier.
- Did your prediction come true?
- Compare your results with other teams to see if their predictions were accurate.
- Jot these results into your Spinner Report.
4.6. Answer the following questions by adding them to the report document.
- When you changed the spinner, why did this change the results?
- Was this a good solution to the problem? Why or why not?
- How does the data you collected support your answer?
- Check with two other groups in the class to see if they agree or disagree with your findings?
Completing this Quest
Answer the questions on the following document. Be sure to turn this in with your spreadsheet & spinner report.
T13Q1 Spin Out Questions
Save your spreadsheet and Spinner report document.
Save to my Documents first. Then save in the Shared All Filename Lastname.firstname.T13Q1.
NETS
1. Creativity and Innovation c. Use models and simulations to explore complex systems and issues
2. Communication and Collaboration
a. Interact, collaborate, and publish with peers, experts, or others employing a variety of digital environments and media
b. Communicate information and ideas effectively to multiple audiences using a variety of media and formats
d. Contribute to project teams to produce original works or solve problems
4. Critical Thinking, Problem Solving and Decision Making c. Collect and analyze data to identify solutions and/or make informed decisions
Common Core Standards
CCSS.ELA-Literacy.CCRA.W.7 Conduct short as well as more sustained research projects based on focused questions, demonstrating understanding of the subject under investigation.
CCSS.ELA-Literacy.CCRA.R.7 Integrate and evaluate content presented in diverse media and formats, including visually and quantitatively, as well as in words.
CCSS.M.6.SP.4
Summarize and describe distributions.
CCSS.M.6.SP.5a
Summarize numerical data sets
CCSS.M.7.SP.6 & CCSS.M.7.SP.7a, 7b Investigate chance processes and develop, use and evaluate probability models
CCSS.MP2
Reason abstractly and quantatively
CCSS.MP3
Construct viable arguments and critique the reasoning of others
CCSS.MP5
Use appropriate tools strategically
