Q5 Information Please
Introduction:
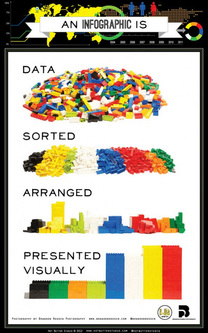
I think you get the picture now, so let's get rolling. It is time for you to design your infographic!
Key Vocabulary:
Infographic: a visual image such as a chart or diagram used to represent information or data
Sequence: a particular order in which related events, movements, or things follow each other
Steps:
1. Start your mission by watching this helpful video clip and then visit easel.ly.
2. To continue, register for a free account. This will allow you to save and share your work.
3. Now that you are registered, let's get down to business.
YOU MAY NOT USE A TOPIC THAT HAS ALREADY BEEN DONE ON THE WEBSITE!!!
Your task is to design an infographic that presents a topic of interest in a simple, creative and visual way. You can create this infographic for another topic you are covering in another class or creating your infographic for another purpose.
Are you up for the task? Check out the details below and then get started!
Completing this Quest
Your teacher will tell you where to place your infographic. There is also a link you can email to your teacher if asked to do so. If you email, you might want to include a message of thanks to your teacher for providing yet another opportunity to flex your techno-creative muscle!
A TIP for you: infographics can be used in a variety of learning environments. You might find yourself creating them in your social studies class for U.S. History to sequence events, in your science class to represent data from experiments or research, or in your math class to display statistics. COOL!
What you need for your infographic:
1. A heading for your topic.
2. At least 5 facts/information about your topic (assume your reader knows nothing about this topic.)
3. At least 5 pictures/images to support your topic.
4. Must use at least 3 different websites to gather your data.
5. Bibliography for your sources using a citation maker (i.e. easybib.com). It must be in correct format. You will put this information on a word document. A simple URL is not citing your source.
The password for the quiz is digital21. Do your best!
Be sure to take a screen shot of your results and turn in for a grade.
NETS
1. Creativity and Innovation
B. Create original works as a means of personal or group expression.
Common Core Standards
CCSS.ELA-Literacy.CCRA.W.8 Gather relevant information from multiple print and digital sources, assess the credibility and accuracy of each source, and integrate the information while avoiding plagiarism.
CCSS.ELA-Literacy.CCRA.SL.2 Integrate and evaluate information presented in diverse media and formats, including visually, quantitatively, and orally.
CCSS.ELA-Literacy.CCRA.SL.5 Make strategic use of digital media and visual displays of data to express information and enhance understanding of presentations.
