Q2 Just Function (Fx)
Briefing
Spreadsheets allow you to organize your data. This quest will help you create and use data in the form of a spreadsheet to make wise decisions. Pay close attention to using functions and graphs so that you can analyze your data effectively. For this Quest you will need to check in with your teacher to establish which activity you will complete.
Spreadsheets allow you to organize your data. This quest will help you create and use data in the form of a spreadsheet to make wise decisions. Pay close attention to using functions and graphs so that you can analyze your data effectively. For this Quest you will need to check in with your teacher to establish which activity you will complete.
Cell Phone Use is an activity where you will use data provided on cell phone usage, minutes and text messages. You will enter the data in a spreadsheet, do totals and averages, and graph the data. Then after analyzing the data you will look at different cell phone plans and recommend the one you think would be best.
Dig the Data - Cell Phone Usage
Student Activity
Your teacher has been contacted by an advertising agency that represents several cell phone companies. Your job is to investigate the data of a typical, middle school student and their phone usage. The data needs to be graphed and analyzed so that the companies can create new usage packages for the middle school aged population customer and their families.
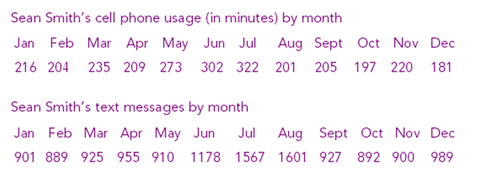
Please use the given data to create a profile of Sean Smith’s phone usage. Then create a graph to represent each set. Once you graph the results you will be asked to draw conclusions from the information. A tutorial has been provided above to help you with this activity, and here is a downloadable document of this Quest 13.Q2.cellphoneanalysis.pdf .
Steps:
Here is your data:
Student Activity
Your teacher has been contacted by an advertising agency that represents several cell phone companies. Your job is to investigate the data of a typical, middle school student and their phone usage. The data needs to be graphed and analyzed so that the companies can create new usage packages for the middle school aged population customer and their families.
Please use the given data to create a profile of Sean Smith’s phone usage. Then create a graph to represent each set. Once you graph the results you will be asked to draw conclusions from the information. A tutorial has been provided above to help you with this activity, and here is a downloadable document of this Quest 13.Q2.cellphoneanalysis.pdf .
Steps:
Here is your data:
1. Create a new spreadsheet in Excel (Google docs, open office, etc).
2. Input Sean Smith’s data on 2 sheets. (Advanced users can create 2 columns on 1 sheet and use the ctrl command to highlight the needed data for each graph).
3. Create a new row below the names of the months and title it Total. Use the sum feature shown in Quest 1, to get a total number of cell phone minutes, and also for the number of text messages.
4. Create a new row below the total and title it Average. Calculate the average number for the year by putting your mouse in the cell for the average and type = (click in the total cell) and / (divided by) and enter the number of months.
5. Create a bar graph for each set of data. (2 graphs) by selecting the cells with the names of the months, and the cells with the data for the months.(Highlight both columns of data).
- Click the insert tab
- Select the bar or column graph
- Select your chart type as a 2 Dimensional chart
- Click on the layout tab & work in the chart title and axis title buttons.
- Be sure to use specific information for your titles.
- Take a screenshot of each page of data and chart
Copy and answer these questions in your document:
- How many months did Sean exceed the average? Cell phone. Text Messages.
- Which representation was the most useful? The excel bar graph or the numbers on the spreadsheet? Why?
6. Open a word processing document and paste an image capture of both sheets of your spreadsheet with the graphs showing. Save it and continue.
7. Copy and paste the following questions into your document below the image capture and answer them.
- What is the average number of minutes Sean used on cell phone calls?
- What is the average number of text messages that Sean used?
- What is the yearly total for minutes used and the total for texts?
- How do these numbers compare?
- Looking at both sets of data, explain a trend that you see in Sean’s cell phone use.
- What is a logical explanation for what you see in the usage throughout the year?
- Copy your data from the Text Message Sheet to a new sheet. Label that new sheet: No Summer Text Messages. Find the three highest text message months in your bar graph and put a 0 in the spreadsheet for those 3 months (exclude them).
- What changes does this cause in the graph?
- How does this affect the total and the average?
8. Select a picture to insert into each sheet that reflects cell phones and texting. You should have 3 pictures total.
9. Help Sean pick a plan. Explore the different wireless plans Sean could choose from with a limited budget of $50 per month. Use the average number of minutes per month and the average number of text messages per month for this activity. Sean does not have a smart phone, so does not have any data usage.
Click on this link to go to the My Rate Plan site
Use the sliders provided to set the number of average minutes and text messages per month.
Use the Price per month sliders so that the plan does not exceed the budget of $50 per month.
What plan do you recommend? Will Sean need a 2-year contract plan or will a monthly plan work? If Sean gets a smartphone for a Christmas or Birthday present, how much data could Sean use and still be within his budget of $50.? Be sure to check and uncheck the contract or pre-paid plans as you make your recommendation.
Write a paragraph summarizing which features seem to make the most difference in the cost of plans?
Completing this Quest
Your directions for completing this quest are listed in the directions for the activity above. Be sure that you have submitted your work to your File Space. Lastname.firstname.T13Q2
NETS
2. Communication and Collaboration
A. Interact, collaborate, and publish with peers, experts, or others employing a variety of digital environments and media
5. Digital Citizenship
B. Exhibit a positive attitude toward using technology that supports collaboration, learning, and productivity
C. Demonstrate personal responsibility for lifelong learning
6. Technology Operations and Concepts
A. Understand and use technology systems
Common Core Standards
CCSS.ELA-Literacy.CCRA.L.1 Demonstrate command of the conventions of standard English grammar and usage when writing or speaking.
CCSS.ELA-Literacy.CCRA.L.2 Demonstrate command of the conventions of standard English capitalization, punctuation, and spelling when writing.
CCSS.ELA-Literacy.CCRA.W.4 Produce clear and coherent writing in which the development, organization, and style are appropriate to task, purpose, and audience.
CCSS.M.6.SP.4
Summarize and describe distributions.
CCSS.M.6.SP.5a
Summarize numerical data sets
CCSS MP4. MOdel with Mathematics.
CCSS MP5. Use appropriate tools strategically
